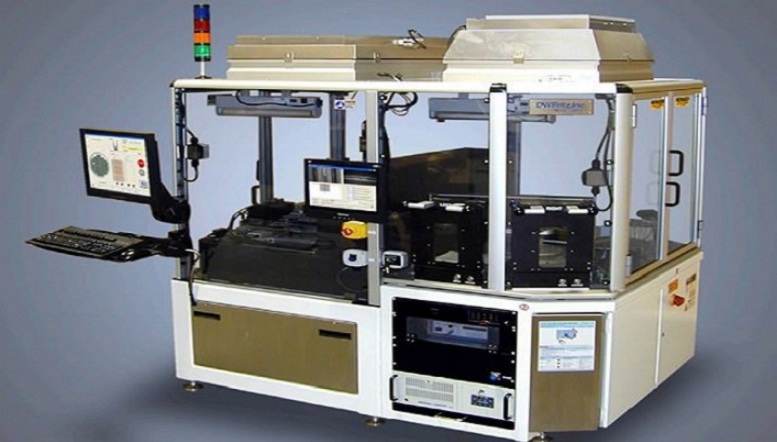
Camtek (NASDAQ:$CAMT) is a public company that provides semiconductor equipment and testing. However, the company is only one of 21 other companies in the same industry. So how does Camtek compare to its competitors?
What is Camtek?
Camtek Ltd is a company in the semiconductor industry. They work on automated and technological solutions for production processes and products yield that enables their customers to produce printed circuit boards and semiconductor fabrication. They design, develop, manufacture and market products in two categories. The first is Automated Optical Inspection and the second is Functional Ink Technology.
Analysts Ratings
Camtek currently has 1 ‘Hold’ rating and 1 ‘Buy’ rating, for a rating score consensus of 2.50. Meanwhile, its competitors have an aggregate total of 1346 ‘Buy’ ratings, 656 ‘Hold’ ratings, 110 ‘Sell’ ratings and 51 ‘Strong-Buy’ ratings. This gives them an aggregate consensus of 2.62.
The target price for shares of Camtek is $7.00, which suggests a possible upside of 44.03%. It’s competitors, on the other hand, have an aggregate potential upside of only 10.55%. This plainly shows that Camtek has much more potential than its competitors, putting it well ahead of the pack.
Valuations and Earnings
Camtek has an EBITDA of $13.85 million with a gross revenue of $116.68 million. This indicates a Price/Earnings Ratio of 60.75. Its competitors, on the other hand, have an EBITDA of $379.05 million and a gross revenue of $1.64 billion, suggesting a Price/Earnings Ratio of 9.26. The grossly higher Price/Earnings ratio indicates the company is currently more expensive than other companies in the industry.
Profitability
Overall, Camtek has a Return on Equity of 15.32% and a Return on Assets of 10.10%, giving them a Net Margin of 2.56%. It’s competitors, on the other hand, have a Return on Equity of 12.25% and a Return on Assets of 7.10%, giving them a Net Margin of 6.59%.
Insiders and Institutions
Currently, institutions own 18.3% of Camtek, while its competition is 78.9% institutionally owned. Insiders, meanwhile, own 79.4% of Camtek, while their competition sits at a rather shallow 14.7% insider ownership.
While strong insider ownership indicates insiders’ faith in the company, institutional ownership indicates outside institutions interest in the firm. Camtek’s relatively bearish institutional reputation contrasts with its bullish insider reputation, giving its competition the edge in the former.
What are the Risks?
Camtek’s competitors have a beta of 1.18, 18% more volatile than the S&P 500, while Camtek has a beta of 0.98, 2 % below the S&P 500. This means that Camtek is, on average, less volatile and less risky than its direct competitors.
The Bottom Line
Camtek beats its competition in 8 out of the 13 factors that we compared, giving it an edge and making it a leading stock in its industry.
Featured Image: twitter


