Note: The following is an excerpt from this week’s
Earnings Trends
report. You can access the full report that contains detailed historical actual and estimates for the current and following periods,
please click here>>>
Here are the key points:
-
The picture emerging from the Q2 earnings season is one of all-around strength, with aggregate total quarterly earnings on track to reach a new all-time record and impressive momentum on the revenue side.
-
For the 378 S&P 500 members that have reported Q2 results already, total earnings are up +103.8% on +28.2% higher revenues, with 87.3% beating EPS estimates and 86.5% topping revenue estimates.
-
While the outsized earnings growth pace is mostly due to easy comparisons, primarily in the Finance sector, the performance on the revenue front (growth rate as well as beats percentage) is tracking above what we have been seeing in other recent periods.
-
For the Tech sector, now have Q2 results from 85.1% of the sector’s market capitalization in the S&P 500 index. Total earnings for these Tech companies are up +66% from the same period last year on +26.3% higher revenues, with 96.2% beating EPS estimates and 94.3% beating revenue estimates.
-
For the Finance sector, now have Q2 results from 82.6% of the sector’s market capitalization in the S&P 500 index. Total earnings for these Finance companies are up +179.4% from the same period last year on +8.5% higher revenues, with 92.7% beating EPS estimates and 81.7% beating revenue estimates.
-
Excluding the unusually high Finance sector earnings growth, total Q2 earnings growth for the remainder of the index members that have reported results would be up +88.6% on +31.6% higher revenues.
-
Looking at Q2 as a whole, combining the actual results for the 378 index members that have reported with estimates for the still-to-come companies, total S&P 500 earnings are expected to be up +89.7% from the same period last year on +23.5% higher revenues, with the growth rate steadily going up as companies report better-than-expected results.
-
Looking at the calendar-year picture for the S&P 500 index, earnings are projected to climb +41.7% on +12.4% higher revenues in 2021 and increase +9.7% on +6.5% higher revenues in 2022. This would follow a decline of -1.7% in 2020.
-
The implied ‘EPS’ for the S&P 500 index, calculated using the current 2021 P/E of 23.1X and index close, as of August 3rd, is $191.77, up from $135.38 in 2020. Using the same methodology, the index ‘EPS’ works out to $210.47 for 2022 (P/E of 21.0X). The multiples have been calculated using the index’s total market cap and aggregate bottom-up earnings for each year.
We pointed out last week how the market was unimpressed with the strong Microsoft
MSFT
and Apple
AAPL
earnings releases, but liked the Alphabet
GOOGL
report. We have since seen results from Amazon
AMZN
and Facebook
FB
as well, with the market’s reaction more in-line with how it responded to the Microsoft release.
The big 5 Tech companies – Apple, Microsoft, Alphabet, Amazon and Facebook –combined earned +88% more in Q2 on +35.4% higher revenues relative to the same period last year.
The chart below shows this elite group’s Q2 expectations in the context of what it did in the preceding period and what is currently expected in the coming four quarters.
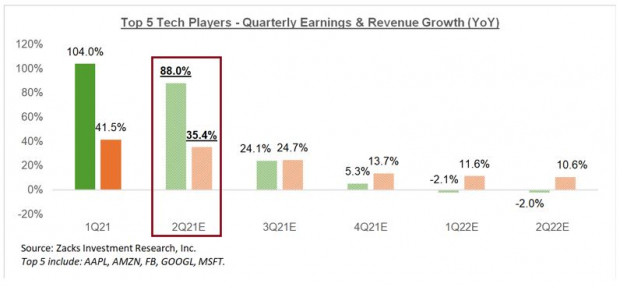
Image Source: Zacks Investment Research
Here is a look at this elite group’s profitability picture on an annual basis.
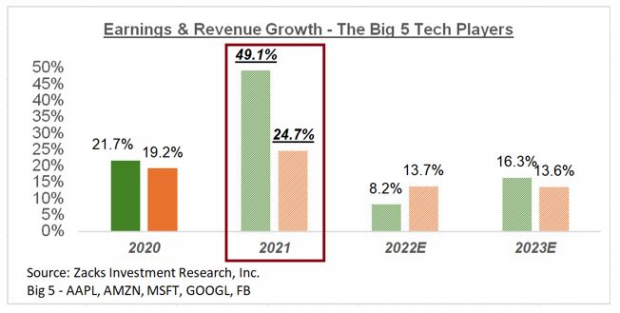
Image Source: Zacks Investment Research
If one were to look for ‘negatives’ in the above picture, it would probably be the coming period of deceleration in the group trend. But given the very positive revisions trend currently in place, I would hazard that estimates for the coming periods will most likely get revised higher.
These are growth rates typically associated with start-ups and much younger companies, not seasoned operators like Microsoft and Co.
The Earnings Big Picture
Estimates for the current period (2021 Q3) are steadily going up, as the chart below shows.
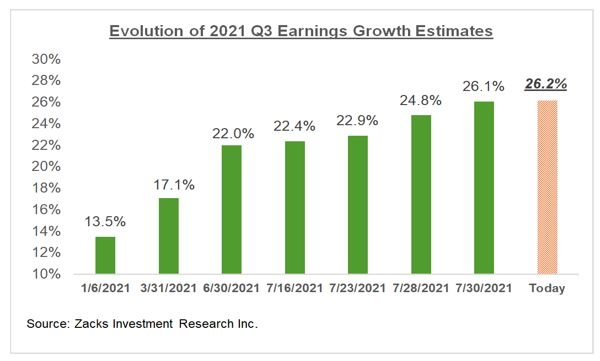
Image Source: Zacks Investment Research
The chart below provides a big-picture view of earnings on a quarterly basis.
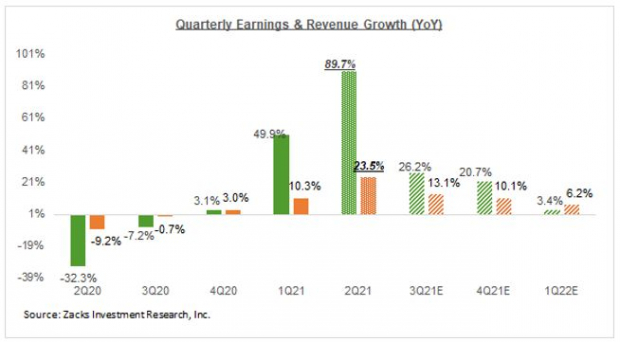
Image Source: Zacks Investment Research
The chart below shows the overall earnings picture on an annual basis, with the growth momentum expected to continue.
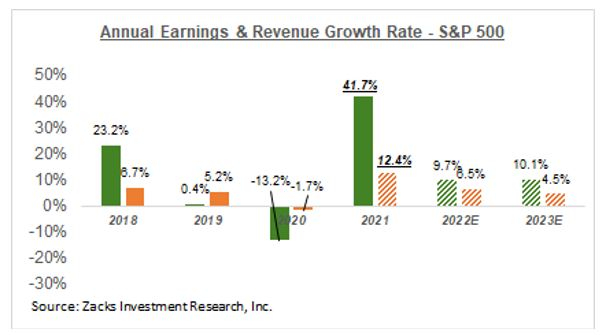
Image Source: Zacks Investment Research
We remain positive in our earnings outlook, as we see the full-year 2021 growth picture steadily improving, with the revisions trend accelerating in the back half of the year.
Breakout Biotech Stocks with Triple-Digit Profit Potential
The biotech sector is projected to surge beyond $775 billion by 2024 as scientists develop treatments for thousands of diseases. They’re also finding ways to edit the human genome to literally erase our vulnerability to these diseases.
Zacks has just released
Century of Biology: 7 Biotech Stocks to Buy Right Now
to help investors profit from 7 stocks poised for outperformance. Our recent biotech recommendations have produced gains of +50%, +83% and +164% in as little as 2 months. The stocks in this report could perform even better.
See these 7 breakthrough stocks now>>
Want the latest recommendations from Zacks Investment Research? Today, you can download 7 Best Stocks for the Next 30 Days.
Click to get this free report


