Amazon’s (AMZN) disappointment isn’t exactly in the same league as what we saw from Netflix (NFLX) some time back. Amazon’s labor-intensive core business with its heavy logistics component leaves it vulnerable to the by-now well-known headwinds of inflation, supply chain issues and higher fuel costs.
That said, both Netflix and Amazon were big beneficiaries of Covid lockdowns that pulled forward demand that needs to be accounted for now. We have seen a number of other Covid winners suffer the same fate in recent days, with Teladoc
TDOC
another recent example.
Among the Big 5 Tech players – Apple
AAPL
, Microsoft
MSFT
, Alphabet
GOOGL
, Meta
FB
and Amazon
AMZN
– Amazon stood out for missing estimates and guiding lower. All the other Tech giants came out with impressive results, though higher expenses and margin pressures appear to be recurring themes from ‘Big 5 Tech’ as well.
Total Q1 earnings for the ‘Big 5 Tech’ players are down -8.4% from the same period last year on +11.4% higher revenues, with a 421 basis-points (bps) compression in net margins. Frist quarter net margins are down for each of the 5 Tech leaders, with the biggest declines at Meta (FB) and Alphabet (GOOGL) at -954 and -998 bps, respectively.
The chart below shows the group’s quarterly earnings and revenue growth picture, with the group’s Q1 performance highlighted.
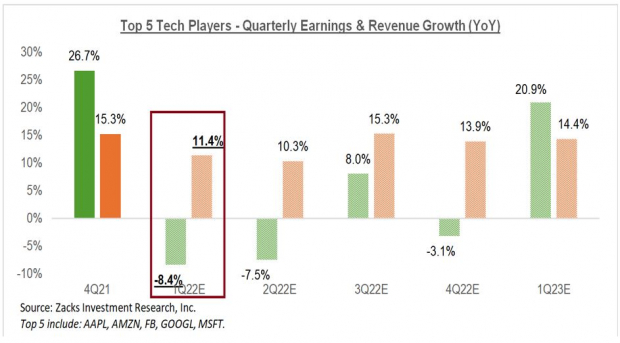
Image Source: Zacks Investment Research
The chart below that shows the group’s earnings and revenue growth on an annual basis.
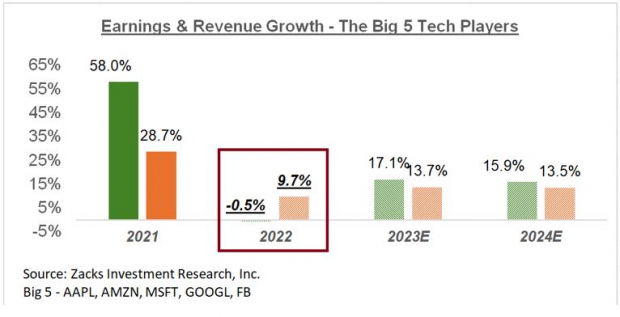
Image Source: Zacks Investment Research
The table below shows the year-over-year change in net margins for the group, on an annual basis. As you can see, Alphabet is the only one in the group whose margins are expected to remain intact in 2022, with Meta and Amazon under the most pressure.
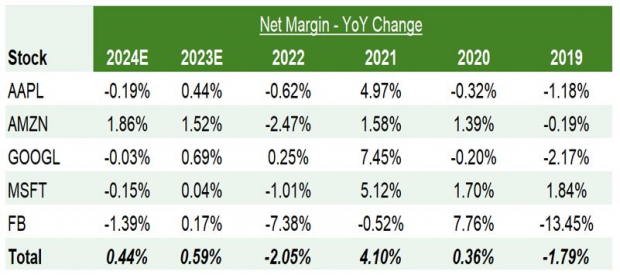
Image Source: Zacks Investment Research
Beyond the big 5 Tech players, total Q1 earnings for the Technology sector as a whole are expected to be down -0.3% from the same period last year on +7.5% higher revenues.
The dramatic looking chart below shows the sector’s Q1 earnings and revenue growth expectations in the context of where growth has been in recent quarters and what is expected in the coming four periods.
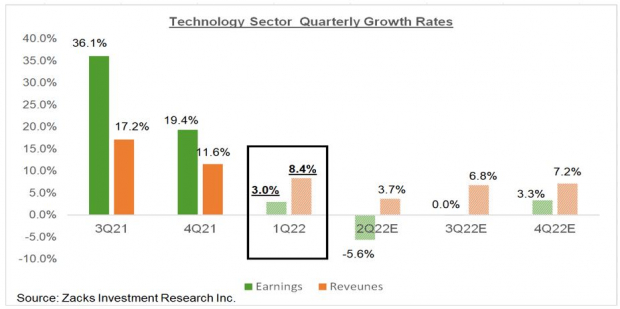
Image Source: Zacks Investment Research
This big picture view of the ‘Big 5’ players and the sector as whole shows a decelerating growth trend. That said, unlike this ‘quarterly view,’ the annual picture shows a lot more stability, as the chart below shows.
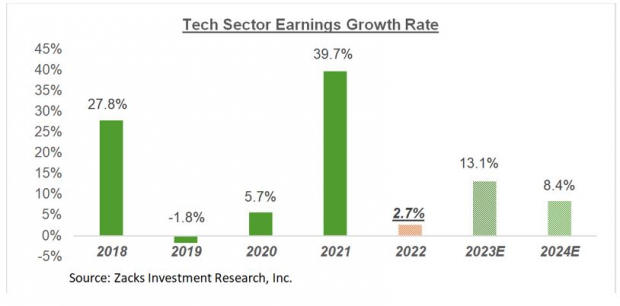
Image Source: Zacks Investment Research
The 2022 Q1 Earnings Season Scorecard
We have crossed the halfway mark in the Q1 reporting cycle, with results from 276 S&P 500 members out through the end of Friday, April 29
th
, 2022. Total earnings for these companies are up +3.9% from the same period last year on +13.4% higher revenues, with 80.8% beating EPS estimates and 74.6% beating revenue estimates.
We remain in the heart of the Q1 earnings season this week, with more than 1300 companies reporting results, including 159 S&P 500 members. By the end of this week, we will have seen Q1 results from 87% of the index members.
The comparison charts below put the 2022 Q1 earnings and revenue growth rates for these 276 index members in the context of what we had seen from the same group of companies in other recent periods.
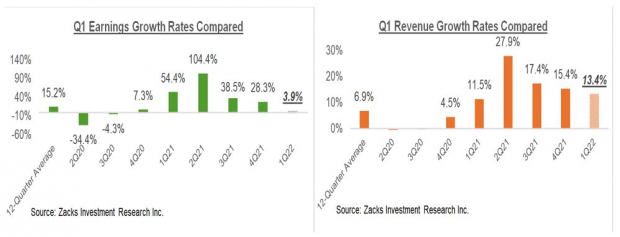
Image Source: Zacks Investment Research
The comparison charts below show the Q1 EPS and revenue beats percentages for these 276 index members in a historical context.
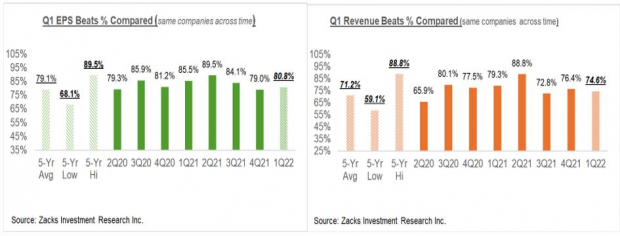
Image Source: Zacks Investment Research
The beats percentages were earlier tracking at their lowest levels in recent quarters, but they have notably improved over the past week.
Looking at Q1 as a whole, with actuals for these 276 index members and estimates for the still-to-come companies, total earnings are expected to be up +7.6% on +12.1% higher revenues.
Excluding the -15.7% decline in Finance sector earnings, the growth rate for the index improves to +14.8%. On the other hand, the Energy sector has a very robust earnings profile at present, with the sector expected to bring in +228.4% more earnings than the year-earlier period on +55.6% higher revenues.
Excluding the hefty Energy sector contribution, earnings for the remainder of the index would be up only +1.8% on +8.9% higher revenues.
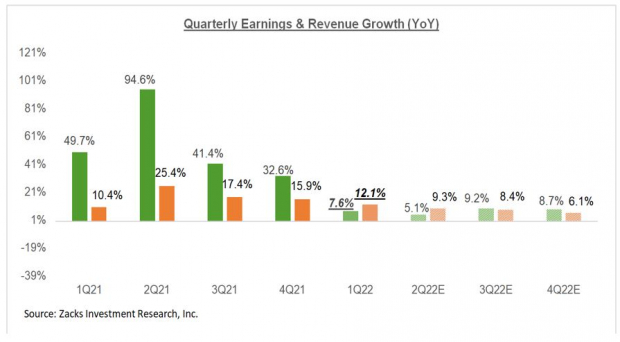
Image Source: Zacks Investment Research
The chart below shows the comparable picture on an annual basis.
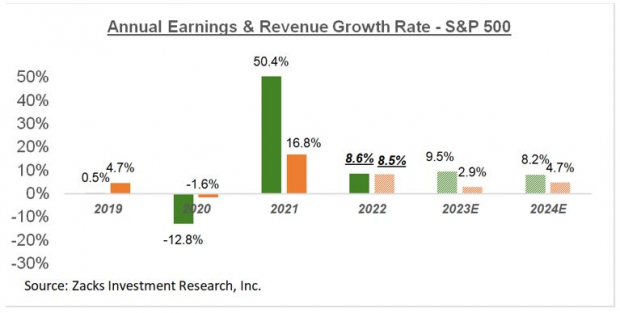
Image Source: Zacks Investment Research
For a detailed look at the overall earnings picture, including expectations for the coming periods, please check out our weekly Earnings Trends report >>>>
Earnings Estimates Come Under Pressure Outside of Energy
7 Best Stocks for the Next 30 Days
Just released: Experts distill 7 elite stocks from the current list of 220 Zacks Rank #1 Strong Buys. They deem these tickers “Most Likely for Early Price Pops.”
Since 1988, the full list has beaten the market more than 2X over with an average gain of +25.4% per year. So be sure to give these hand-picked 7 your immediate attention.
Want the latest recommendations from Zacks Investment Research? Today, you can download 7 Best Stocks for the Next 30 Days.
Click to get this free report


